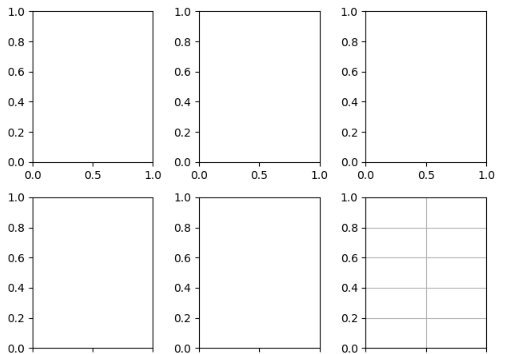
python中使用matplotlib模块的add_subplot函数添加子图,具体方法如下:
from matplotlib import pyplot as plt #导入matplotlib模块
fig = plt.figure()
ax1 = fig.add_subplot(231)
ax2 = fig.add_subplot(232)
ax3 = fig.add_subplot(233)
ax4 = fig.add_subplot(234)
ax5 = fig.add_subplot(235)
ax6 = fig.add_subplot(236)
plt.grid(True)
plt.show()
效果图:

辰迅云「云服务器」,即开即用、新一代英特尔至强铂金CPU、三副本存储NVMe SSD云盘,价格低至29元/月。点击查看>>
推荐阅读: python中怎么定义一个空字典